Code Lab // R Programming

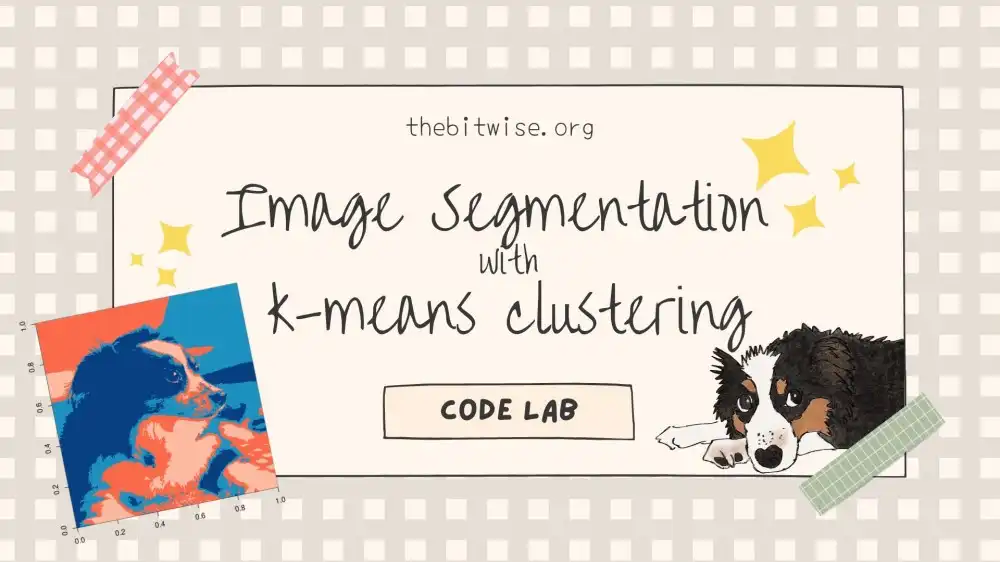
Image Segmentation with k-means Clustering

In our last post, we implemented our own k-means clustering algorithm in R! Today, we'll explore k-means clustering some more with a Code Lab to see how we can use the algorithm we coded up last time to cluster pixels in an image!

The Latest


R Programming // Resources

More Resources for Getting Started with R

We just finished a two-part introductory sequence on Getting Started with Coding in R. Today, let's look at some other useful resources for getting started with R. ...
R Programming // Tutorials

Getting Started with Coding in R (Part 2)

In our previous post on Getting Started with Coding in R (Part 1), we covered how to download and install R and RStudio. In this post, we’ll dive right into coding in R. We’ll do that by quickly building up some skills to complete the following: Write a function to count the total number of heads and tails in a series of coin flips.

R Programming // Tutorials

Getting Started with Coding in R (Part 1)

In future posts, we'll explore some coding projects here. Before jumping in, we'll start with some basics. This post will be the first of two on getting started with coding in R. ...
Site News

Welcome to The Bitwise!

Hi, I'm Jocelyn and I started The Bitwise as an online journal to share coding tutorials, projects, and conversations on careers in statistics, math, and data science. Featured here is my dog, Henry! He'll be our mascot so you'll be seeing more of him in future posts. Thanks for dropping by and please come back for our projects and conversations!


Spotlight


Code Lab // R Programming

Coding a Simple Recommendation System in R

When we shop online, we often get recommendations for other products that are similar to ones we've been looking at. Systems that recommend related products and services are frequently referred to as recommendation systems. In today's Code Lab, we'll code a simple recommendation system using something called cosine similarity!
Code Lab // R Programming

Exploring Trends in Urban Bike Share Data

In our last two posts, we went over how to start making data visualizations in R with ggplot2. Now that we've finished that series, let's work on a Code Lab featuring exploratory data analysis! Today, we’ll be exploring patterns in urban bike share usage...
Code Lab // R Programming

Estimate Pi with Dart Throwing in R!

Now that we’ve had several posts on getting started with coding in R (see Part 1, Part 2, and More Resources) we’re ready to get started with our first Code Lab!  In this post, we’ll see how we can estimate pi with dart throwing in R!